The Postcodes That Use the Most Electricity in the UK
Billpayers in the UK have been hesitating to flick the switch on their kettles since at least autumn 2021. That’s when energy prices began to rise rapidly before a series of record-breaking increases in the wake of Russia’s invasion of Ukraine. By January 2025, despite occasional glimpses of light, the price cap remained £520 or 43% higher than in summer 2021.

“There is no getting used to this new normal for the people we try to help,” said National Energy Action’s Adam Scorer, when energy regulator Ofgem decided to raise the price cap, raising the typical household energy bill by 6% to £1,849 per year, from April 2025. “Millions of the most vulnerable households are struggling with debt and severely rationing their heating.”
Still, actual bills differ from place to place due to regional pricing and usage variations. To find where domestic users are running up the biggest bills, Business Energy UK analysed government data on every postcode area in England, Scotland and Wales.
What We Did
We analysed the latest Department of Energy data to identify the postcodes, postcode districts and cities that use the most domestic kilowatt-hours (kWh) of electricity annually in the UK (England, Scotland and Wales; the DoE dataset does not include data for Northern Irish postcodes). Then, we used regional electricity rates from uSwitch to estimate the average annual spend in each location.
Key Findings
- The wealthy Bishops Avenue (N2 0BG) area of London uses the most electricity of any postcode area, at 46,892 kilowatt-hours (kWh) per year.
- The postcode district that spends the most per household annually is BD1 (Bradford), at £1,108 pa.
- Domestic users in London’s WC1H postcode district have an average annual electricity spend of £357 — the lowest of any UK postcode district.
- The average annual spend on domestic electricity in Aberdeen is £534 per household — the lowest in the UK.
The North London Street That Uses 20x Average Electricity
First, we identified the postcodes with the highest domestic electricity use in kilowatt-hours (kWh). The average home in London’s N2 0BG postcode uses 46,892 kWh annually — more than 20 times the London average (2,310 kWh). Known as Billionaires Row, The Bishops Avenue is lined with mansions priced in the tens of millions and owned by Saudi royals, Hollywood stars and sugar tycoons.
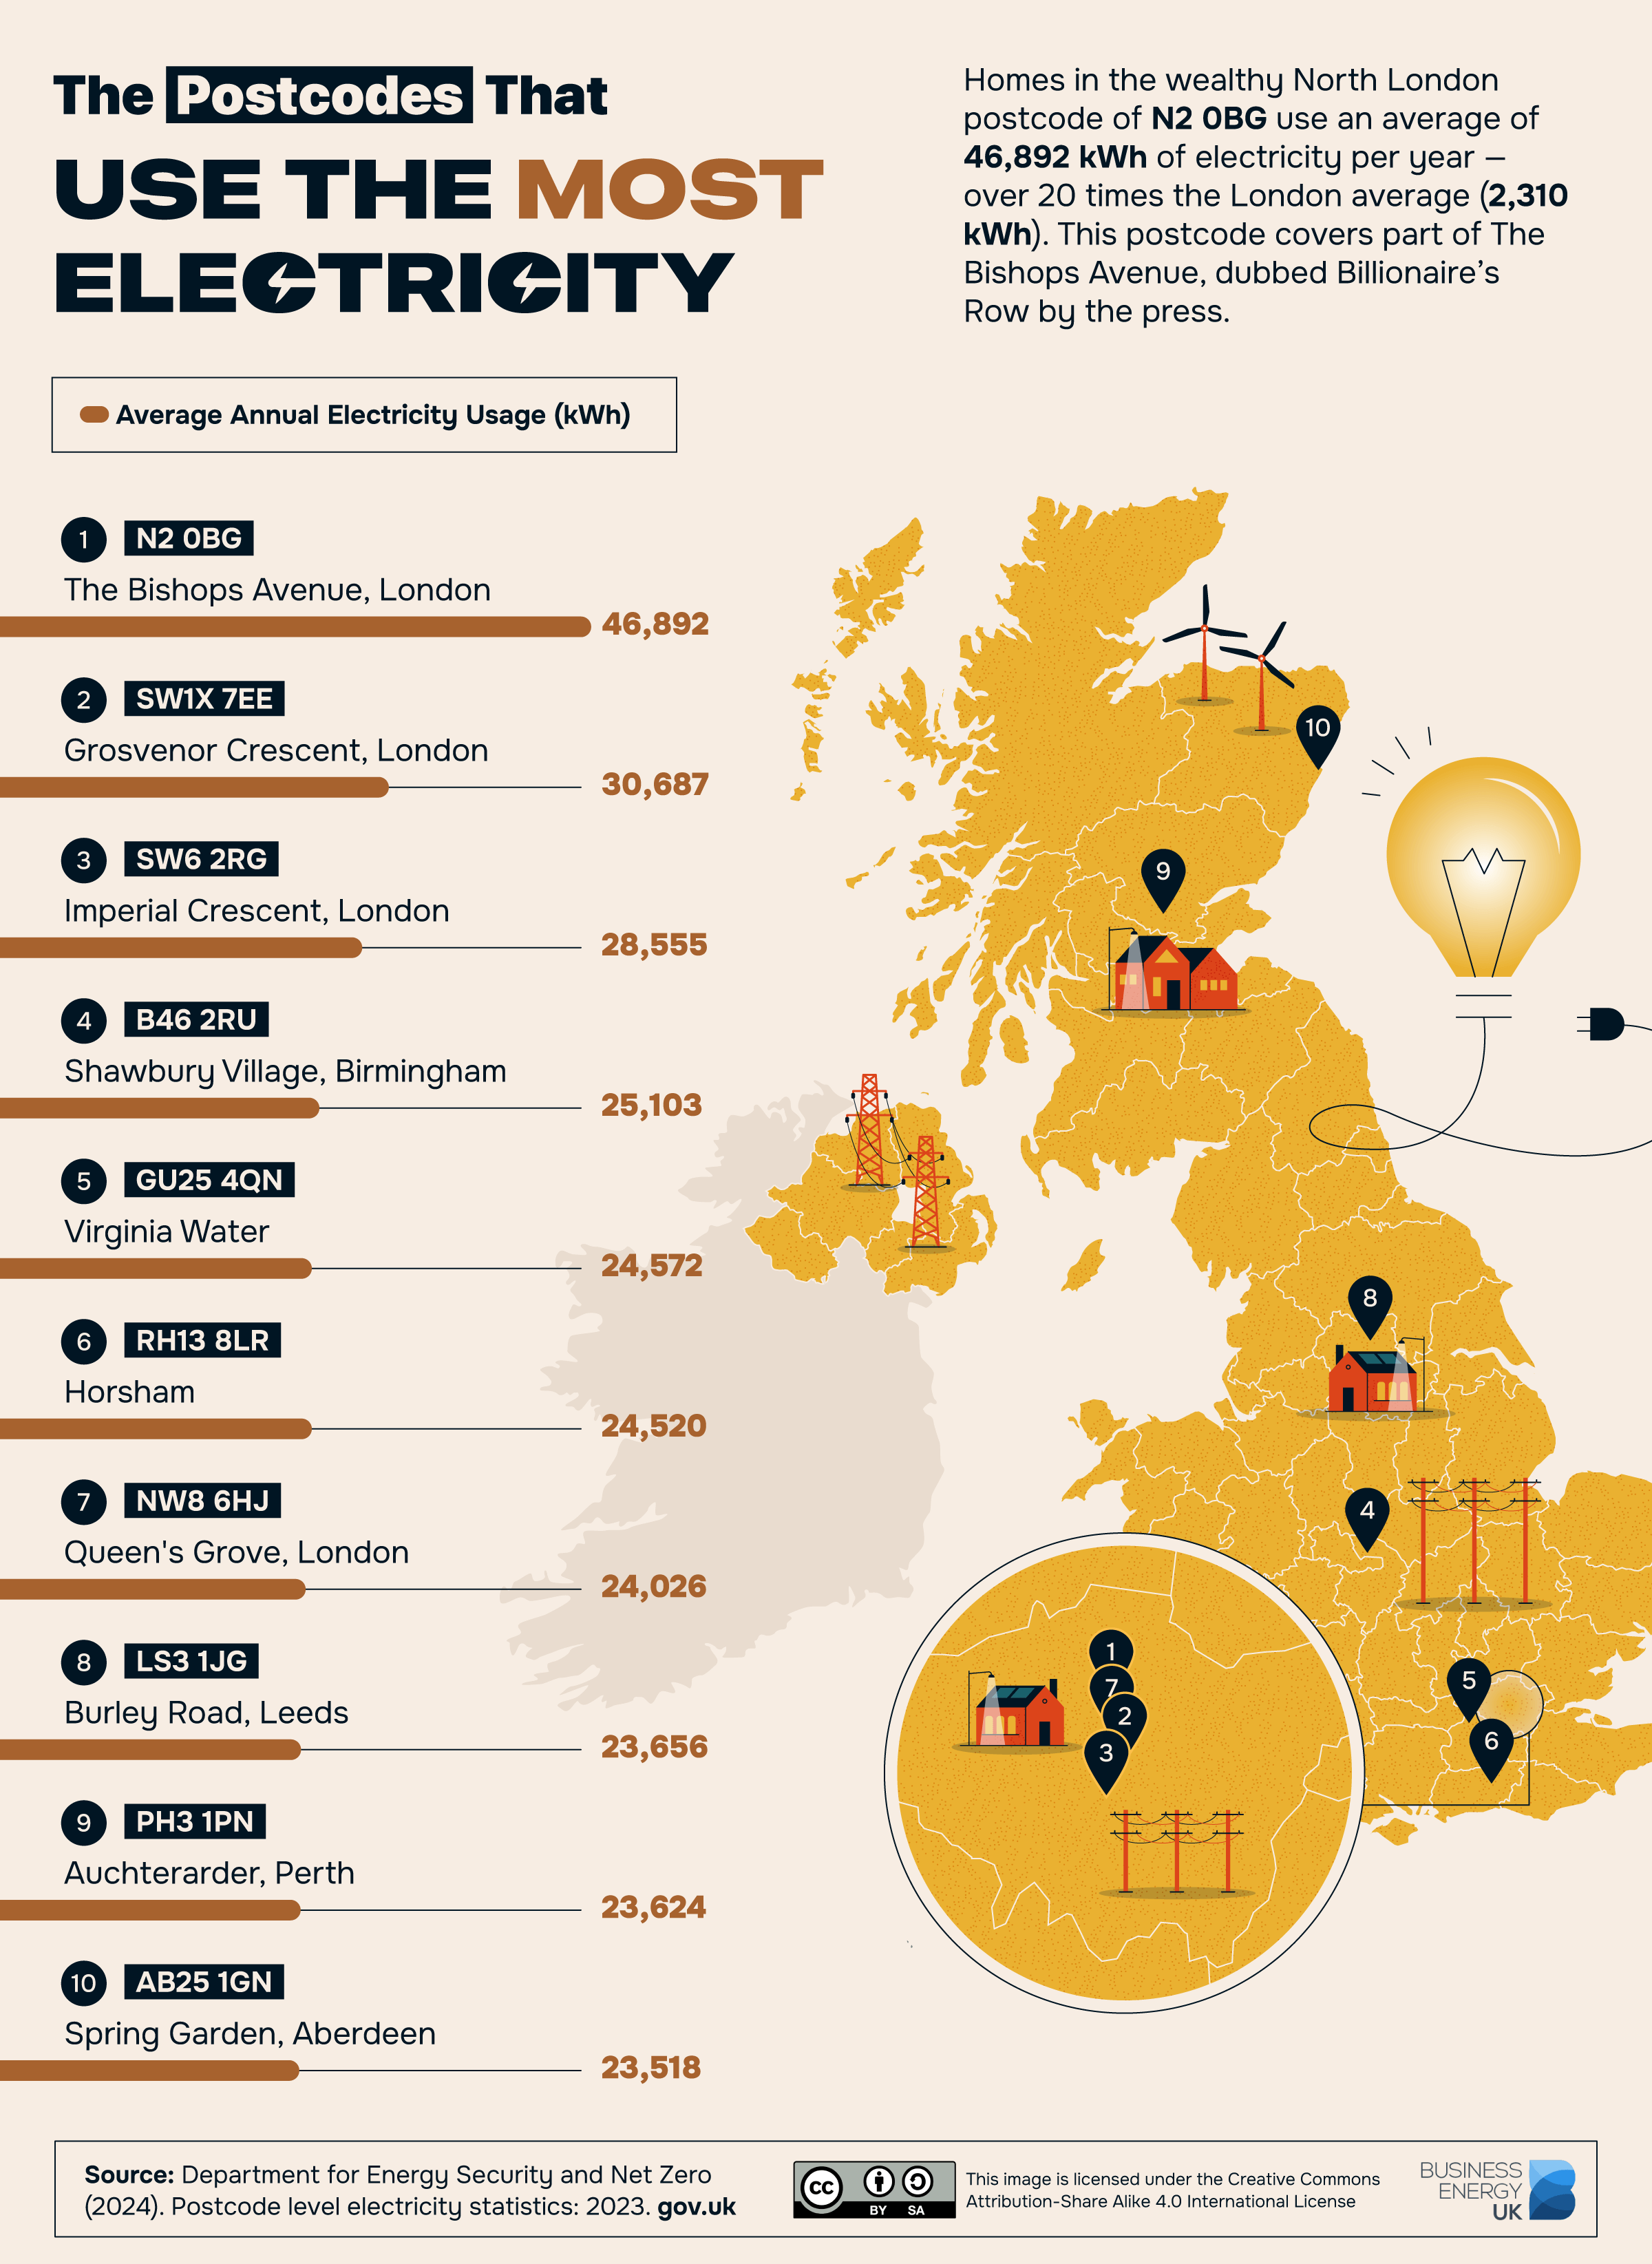
Outside of London, the top electricity users are in B46 2RU, encompassing the small gated community of Shawbury Village in the North Warwickshire countryside. Cala Homes built these houses on a great scale in the 1980s and furnished them with modern conveniences such as electric gates and underfloor heating. The average annual electricity use per home is 25,103 kWh.
Shetland Island Postcode District Among Top Payers for Electricity
The UK’s 1.8 million postcodes are divided into 2,979 districts based on the first part of their code. Our next step was calculating the average annual usage (kWh) and bill for homes in each UK district.
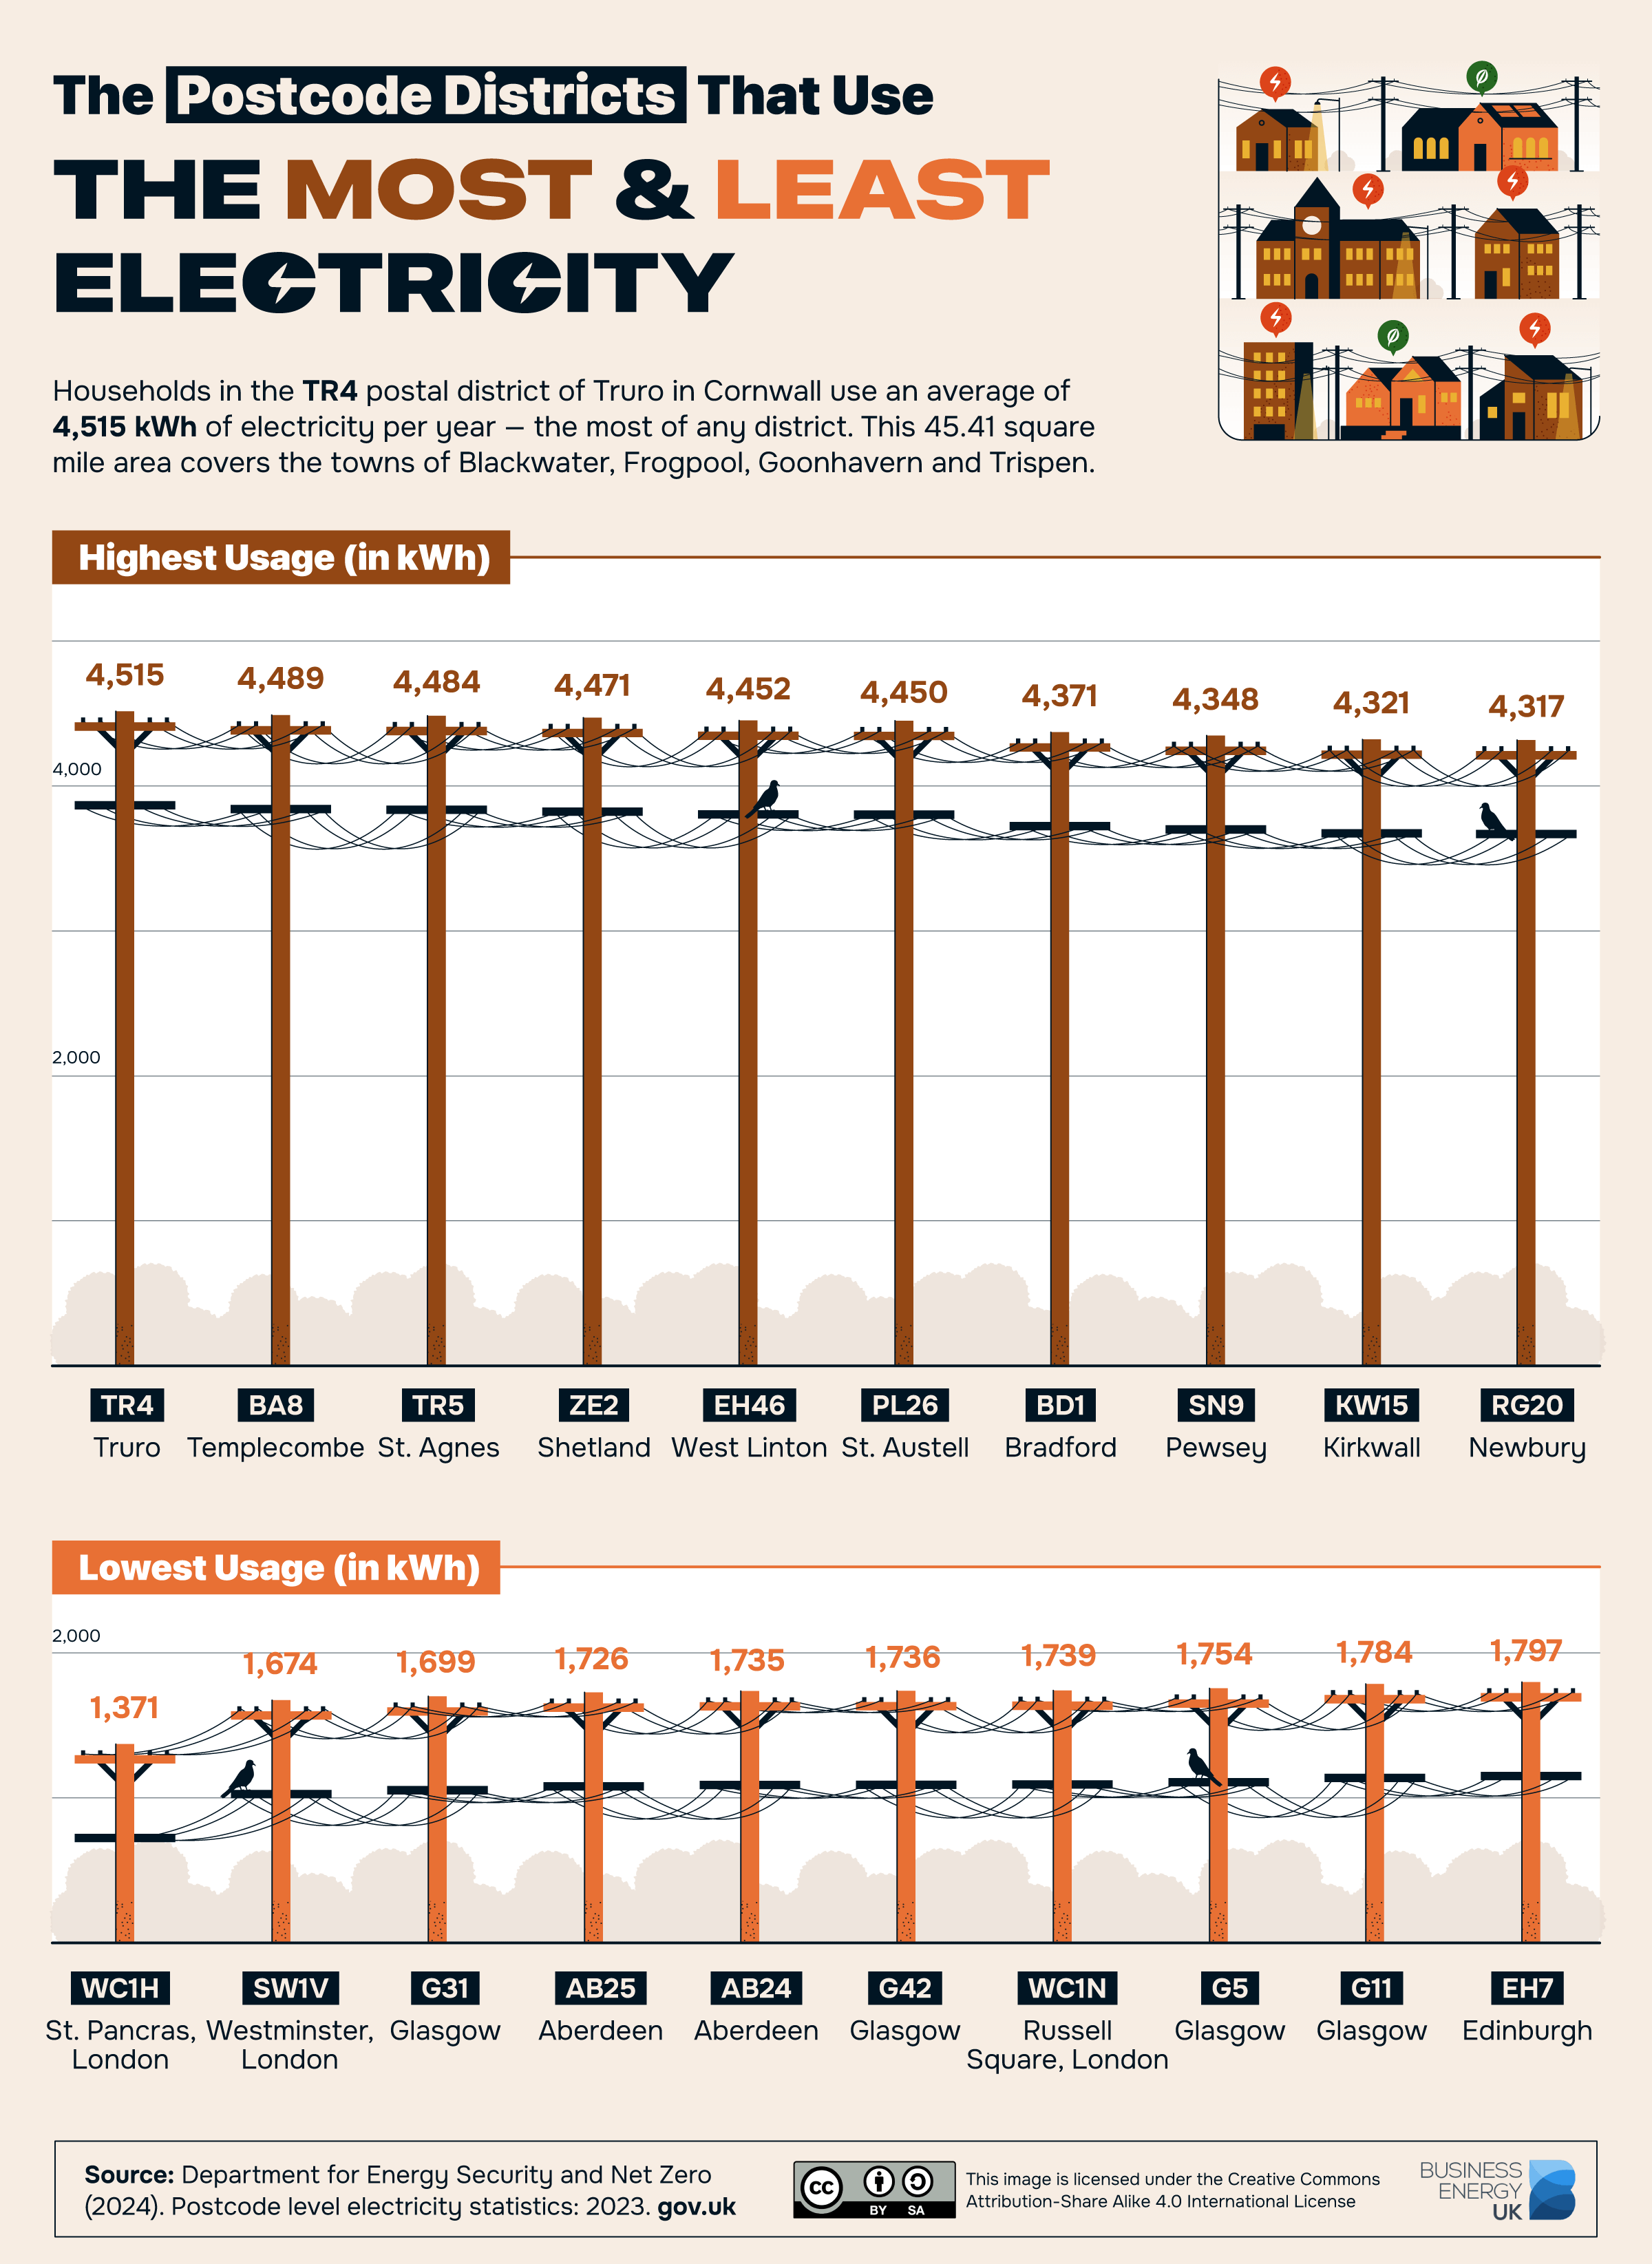
The ranking differs between metrics due to price variations around the country. For example, households in the TR4 district in Truro, Cornwall, use the most electricity on average — 4,515 kWh per year. However, the average annual bill in TR4 is £1,107, less than in BD1 (Bradford) and ZE2 (Shetland), where households pay £1,108 on average. Cornwall’s homes have historically used more energy than the UK average.
In ZE2, Shetland, the average annual bill is just pennies less than the top-placed Bradford postcode district. The islands face a much colder climate than mainland Britain, and statistics show that the cost of living is 20-65% higher than the UK average.
“Our islands have been at the heart of oil and gas activity for over forty years, yet our people have not seen the benefits of that in terms of a lower cost of fuel,” said Council Leader Emma Macdonald in 2022. “Shetland has contributed, and will continue to contribute, significantly to UK energy exports, and yet people in our communities will struggle to heat their homes in the coming year.”
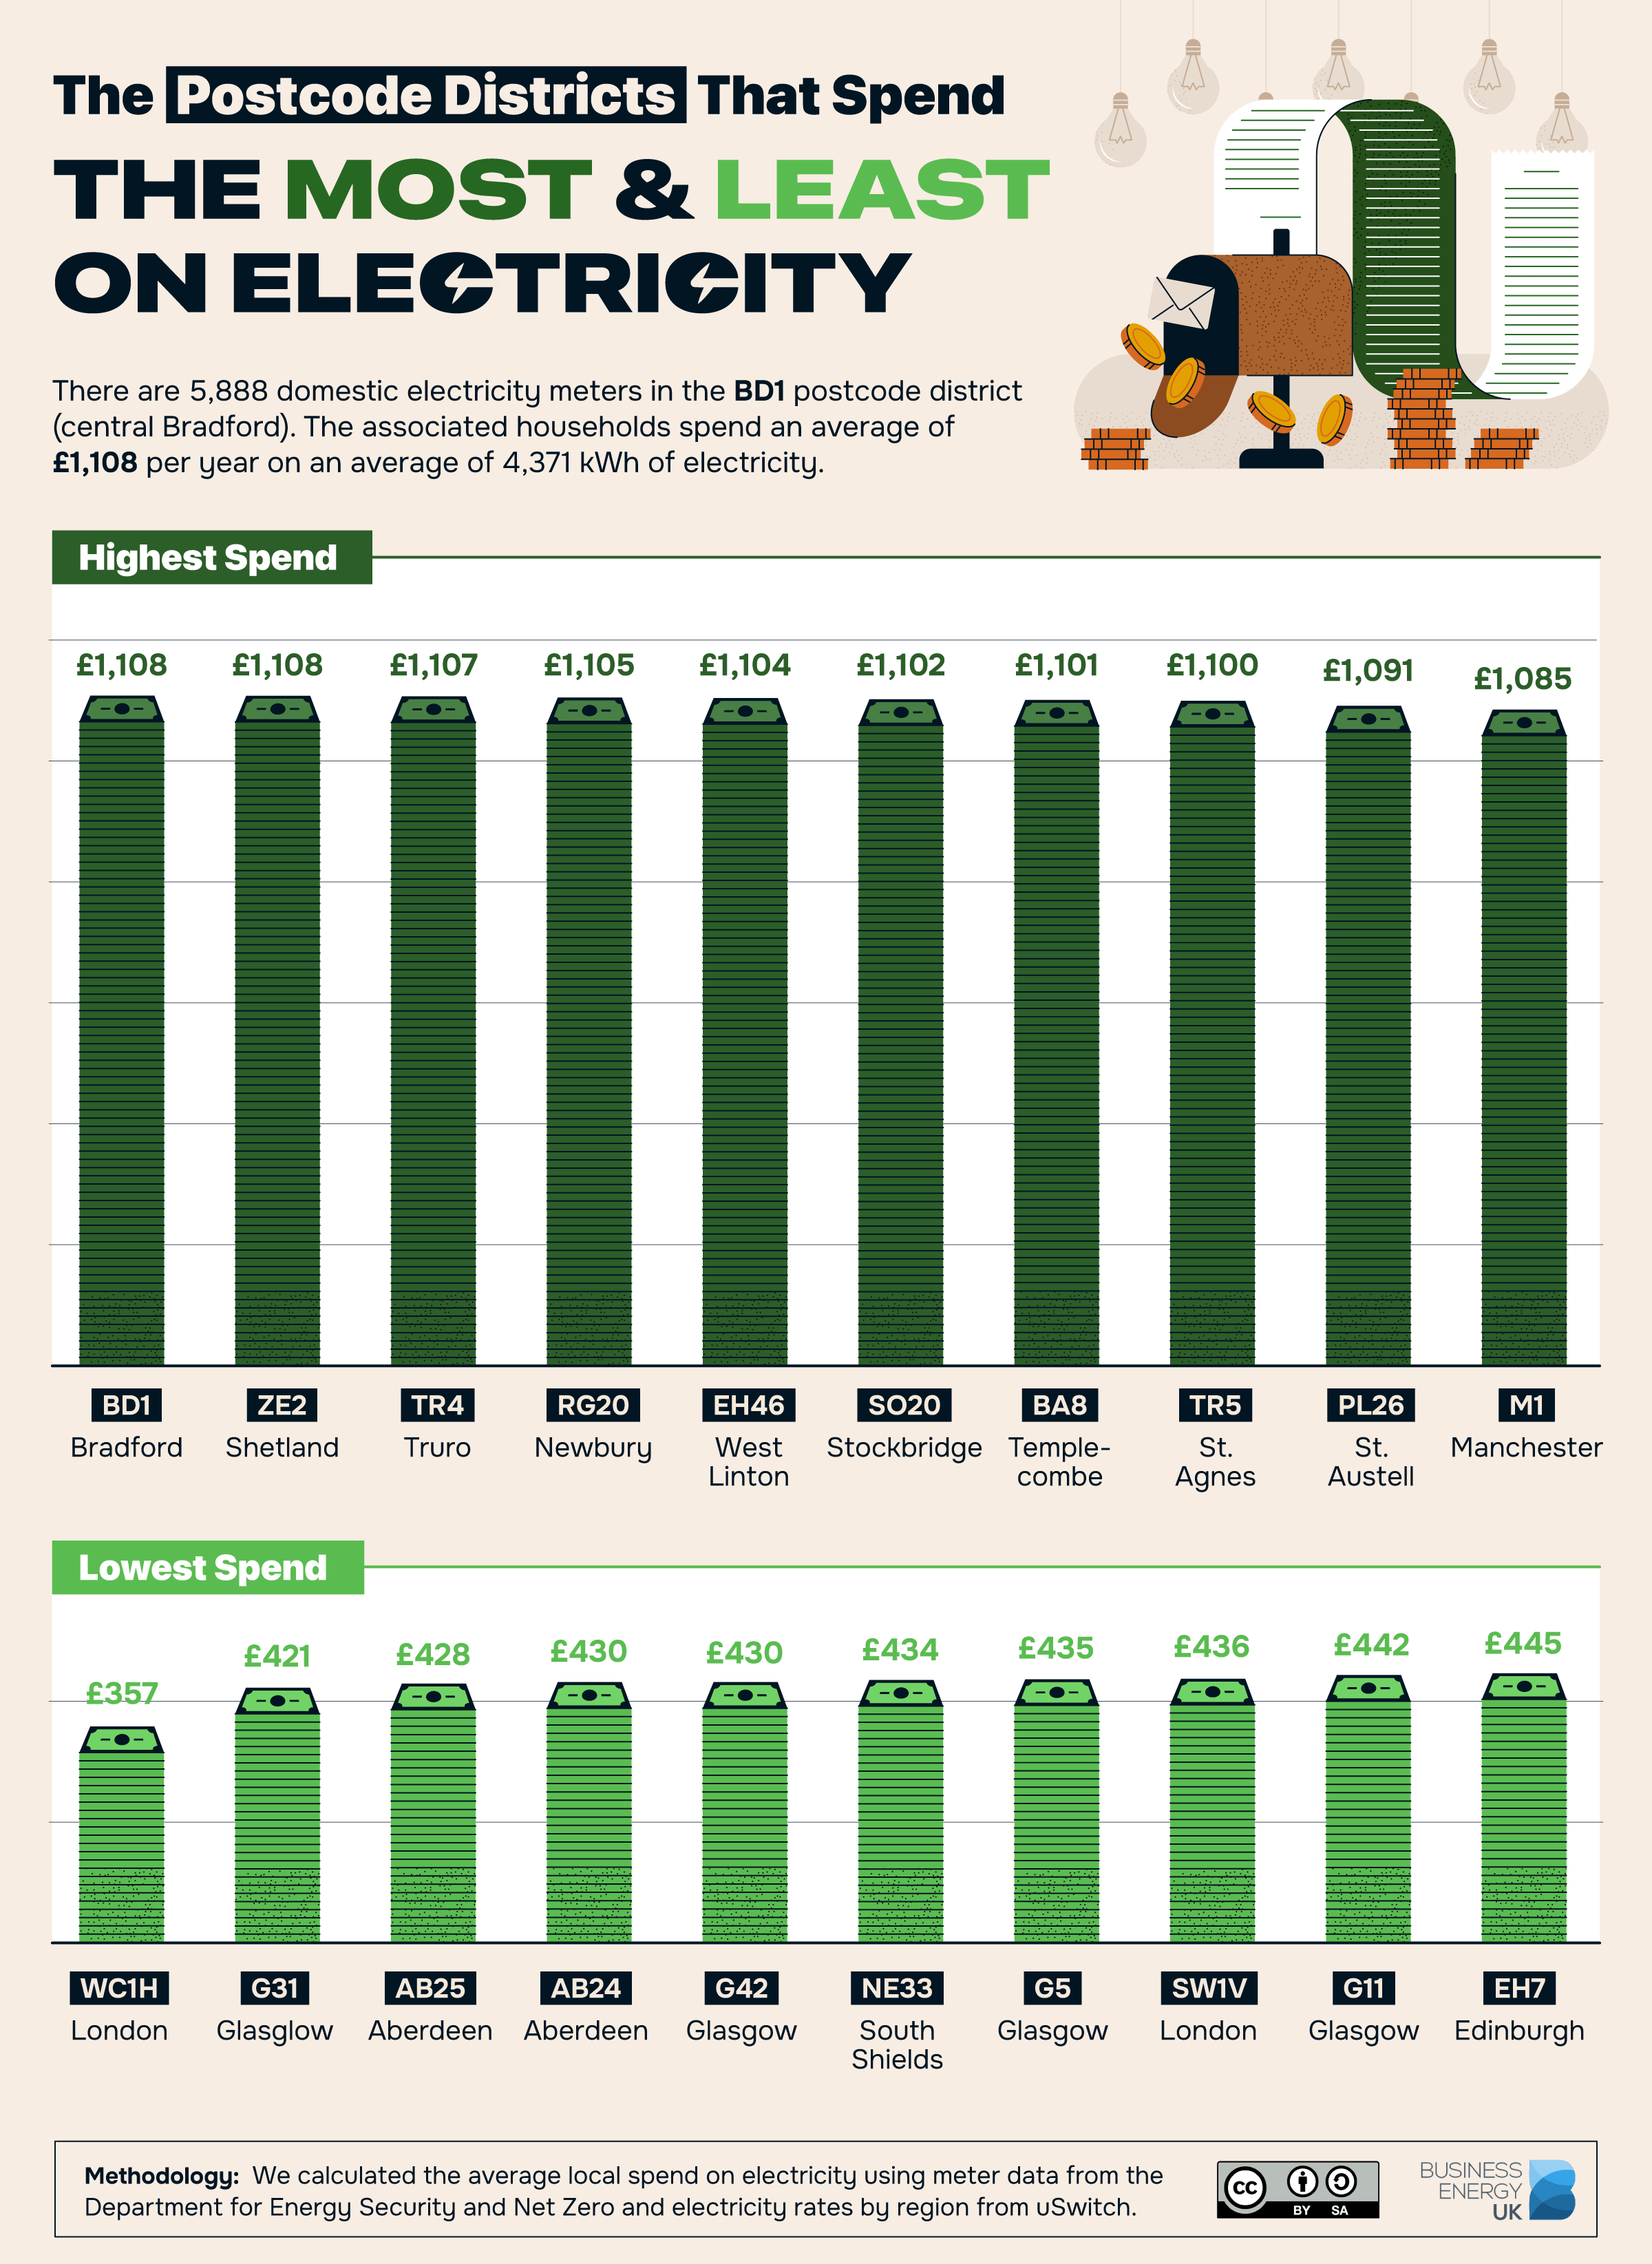
The postcode district with the lowest average bills is WC1H, London, where annual bills are around £357. This relatively small postcode district is clustered around St. Pancras station, near Kings Cross and Euston. It is likely that many domestic spaces are used only intermittently by short-term renters and city workers with a main home outside the city.
Scotland Among Top Regions for Energy Bill Inequality
Next, we used these figures to identify the postcode district in each region where households pay the most and least annually for electricity. Outside of London, the biggest disparity is in Scotland, where the ZE2 district of the Shetlands (£1,108) pays 2.63 times more than the Scottish district with the lowest average bill, G31 in Glasgow (£421).
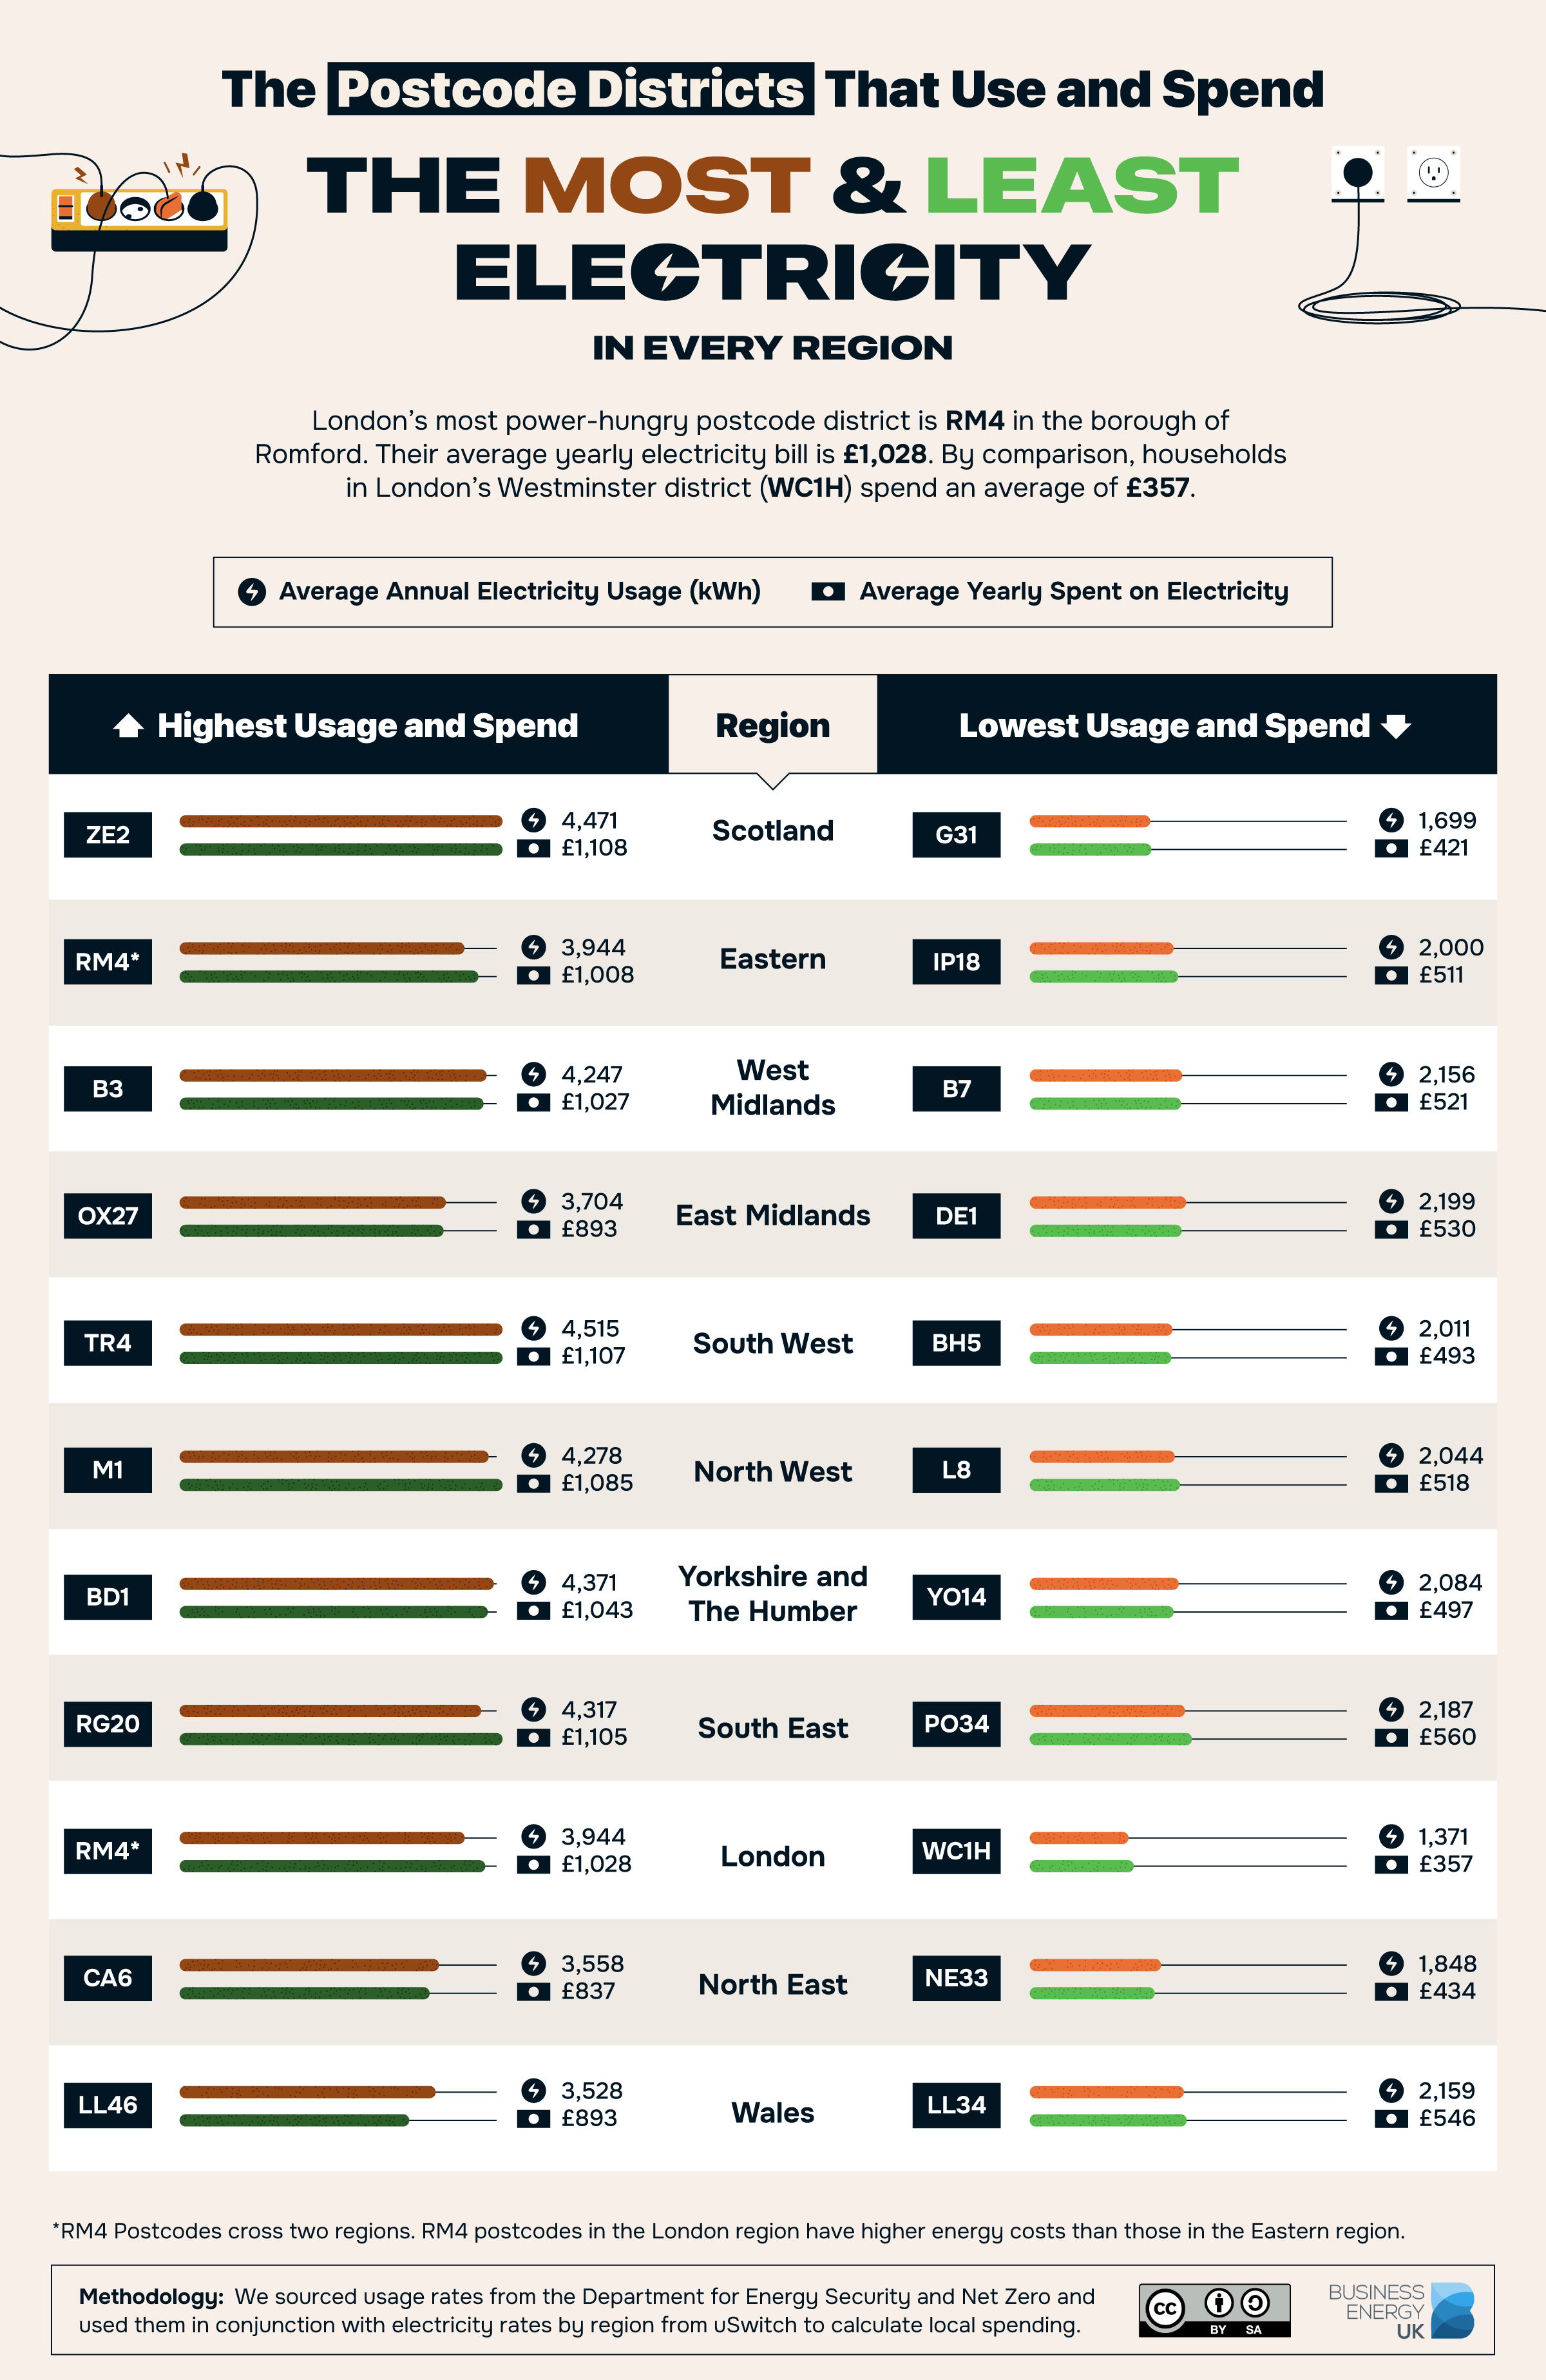
Wales is the region with the lowest disparity between small and big spenders on electricity. The average bill in the LL34 (Penmaenmawr) postcode district is £546, just £346 shy of the top-spending district LL46 (covering Harlech, Llanfair and Gwynedd). The average annual bill here is £893, which is 1.63 times more than in LL34.
Two Big Scottish Cities Use Least Electricity
Finally, we grouped the postcodes together to find the cities with the highest and lowest energy usage and spend per household. In this case, the top and bottom two cities remain the same, whether measured by usage or by the size of their bills.
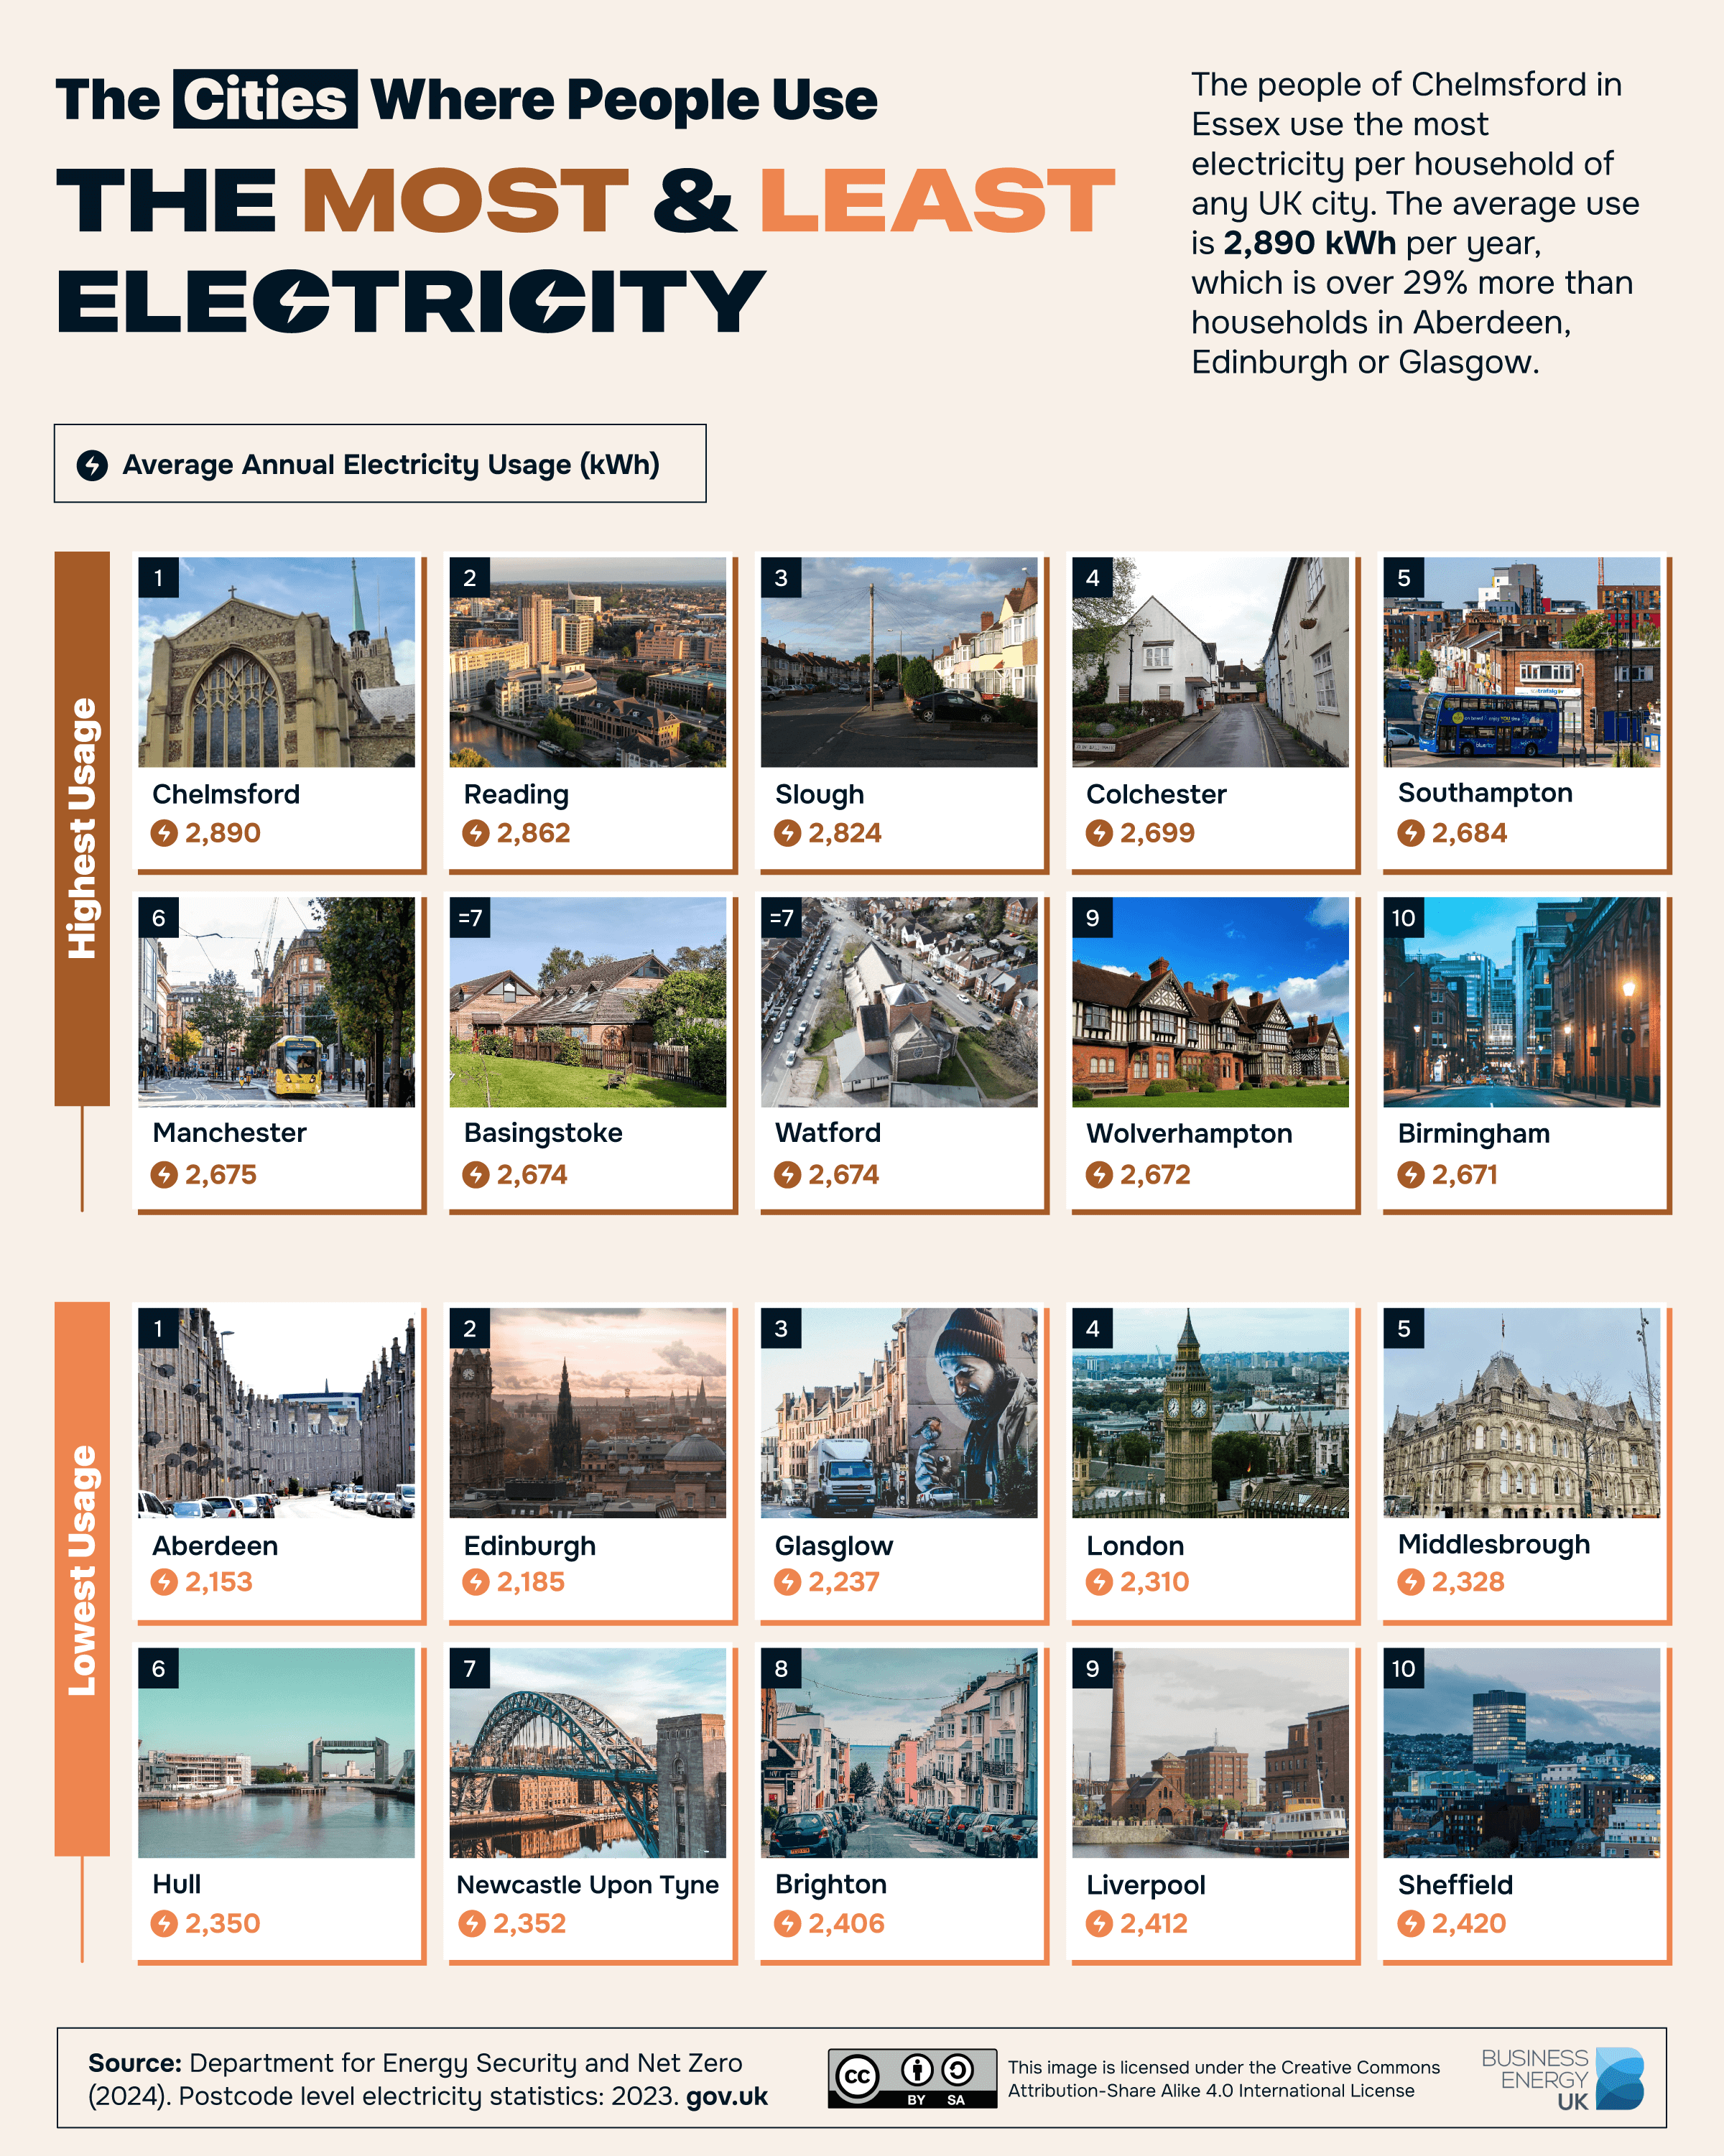
The two cities where households use and spend the most annually are Chelmsford (2,890 kWh/£739) and Reading (2,862 kWh/£733). Citizens Advice reported a nine-fold increase in people asking for help with their energy bills between 2021 and 2024, when 8,302 inquiries were made.
Fraser Gleave, a manager at the charity’s Reading office, said that energy prices began to rise just as Covid-era support schemes ended, and inquiries “really increased through 2022 as the Ukraine crisis sent wholesale energy prices up by unprecedented levels.”
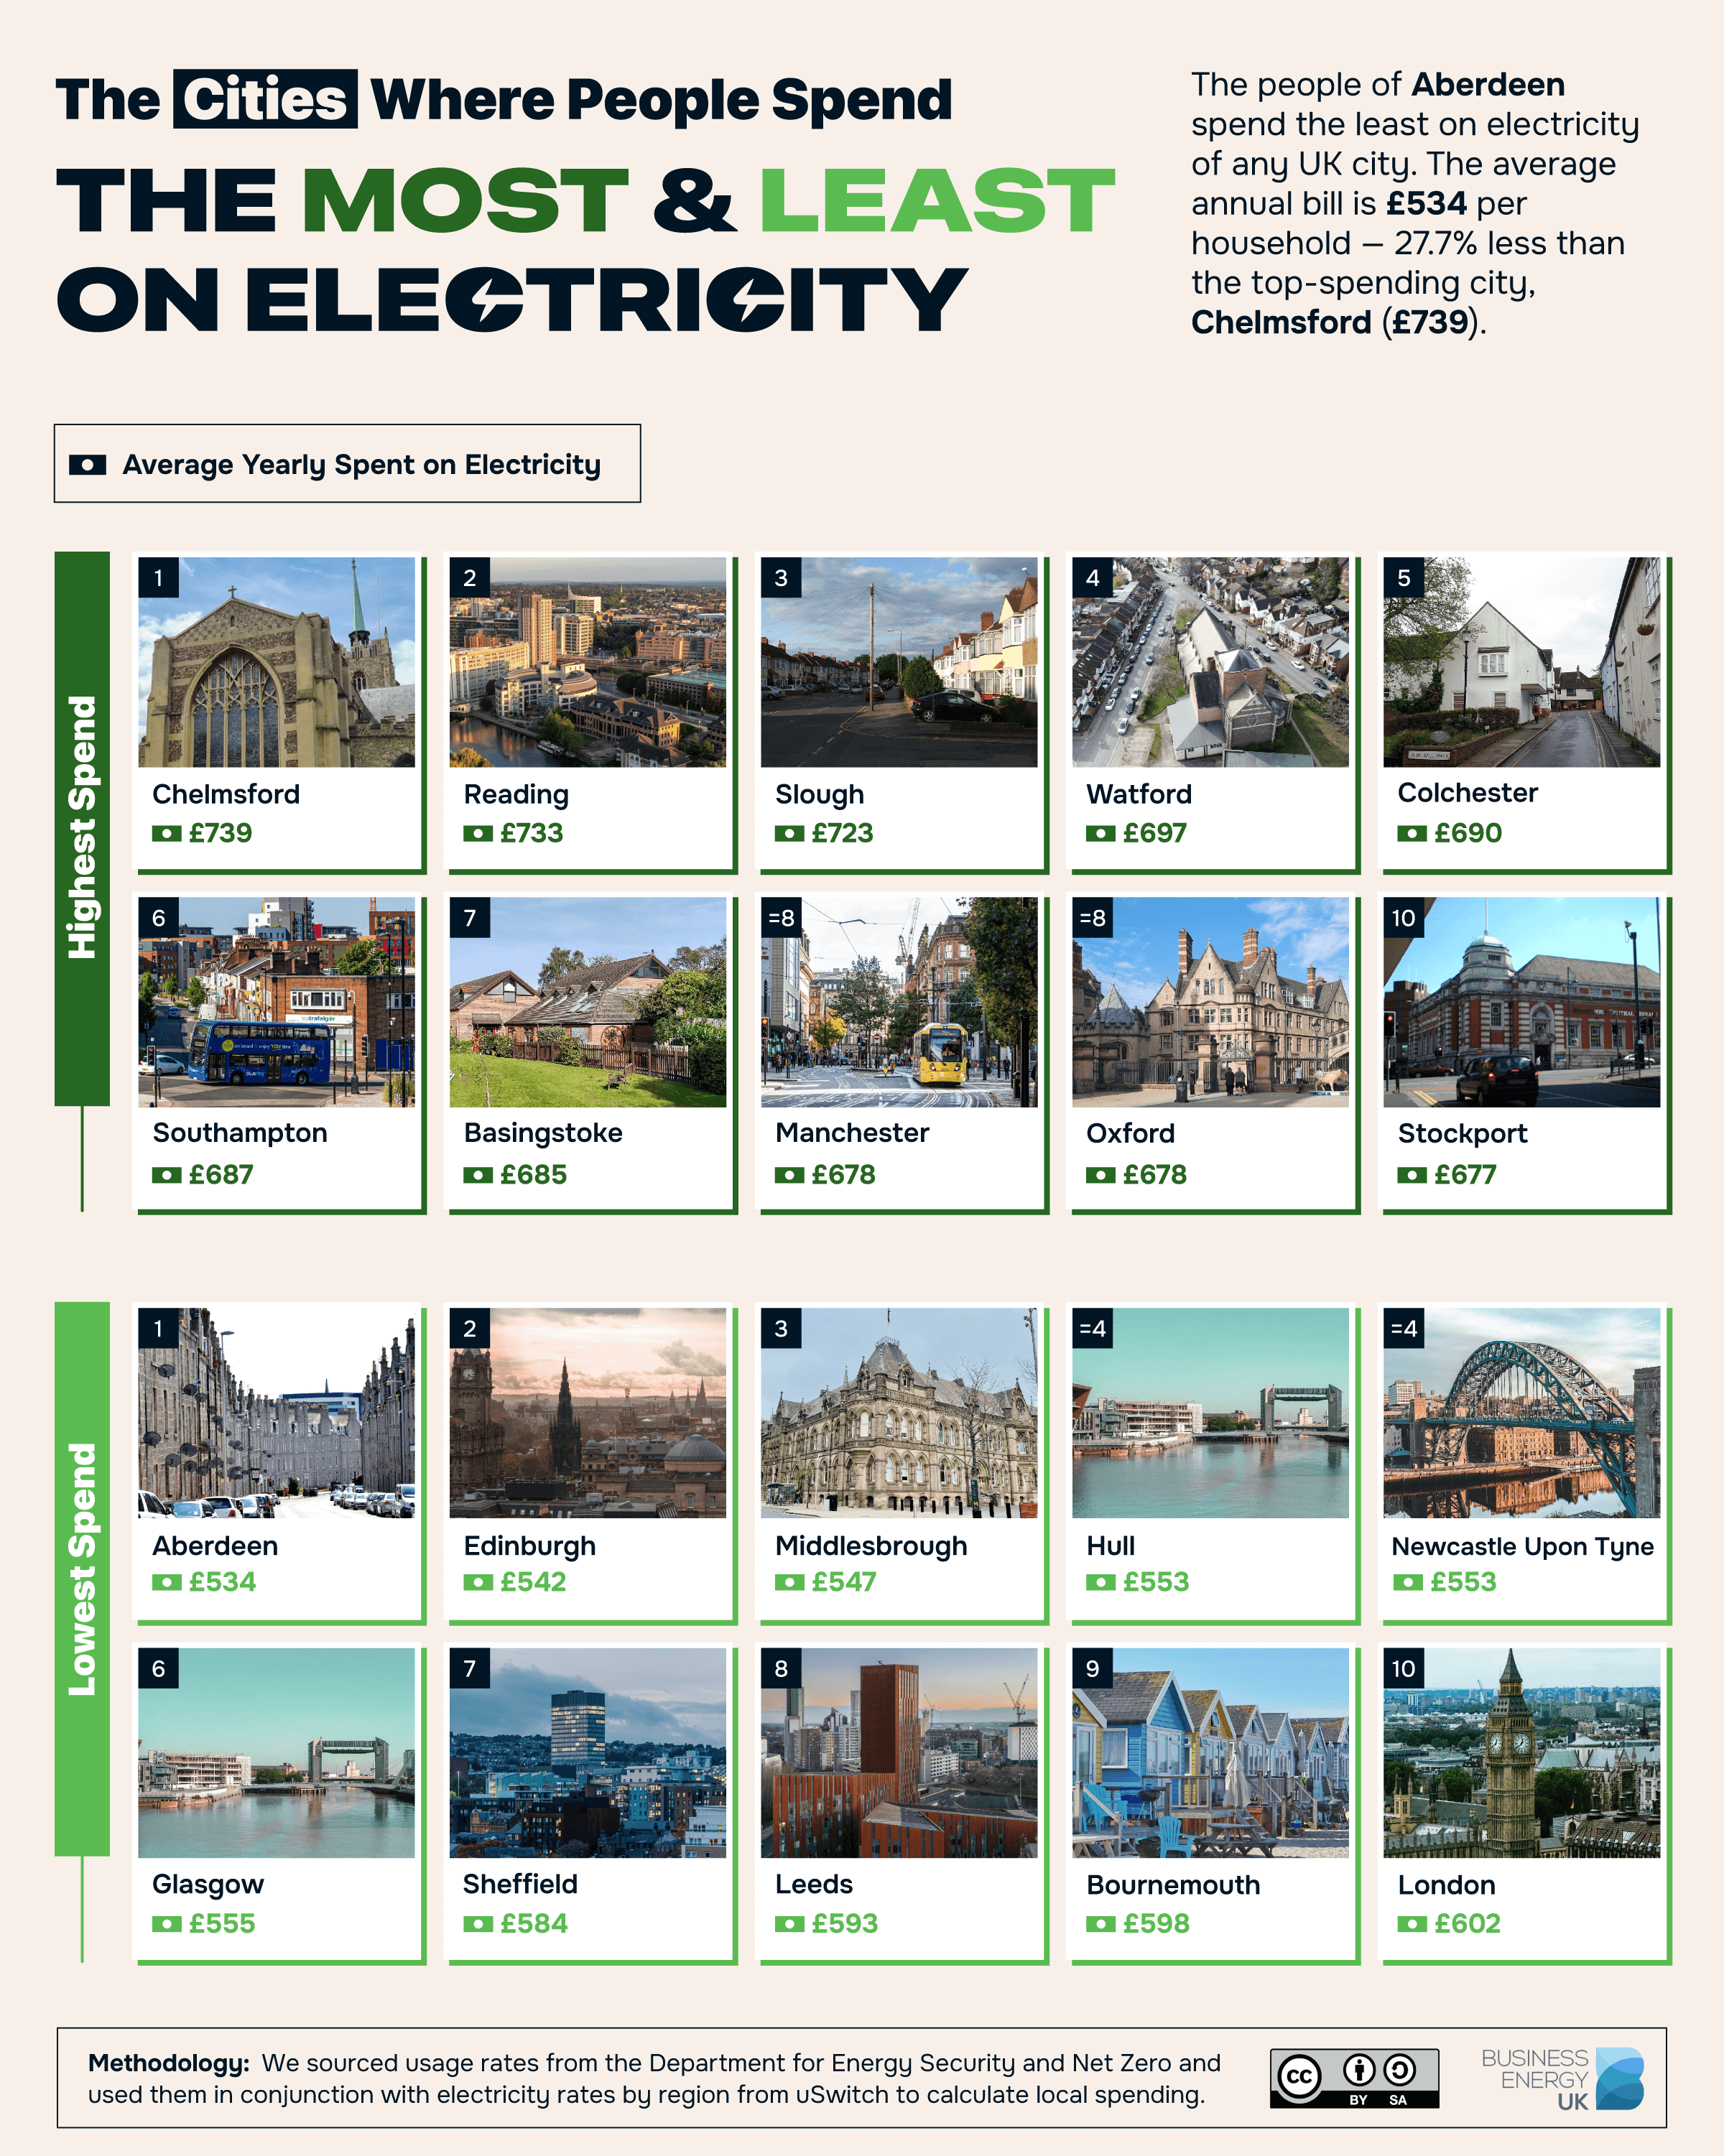
Aberdeen (2,153 kWh/£534 per year) and Edinburgh (2,185 kWh/£542) are the two cities where households use and spend the least on electricity. However, this is not necessarily a healthy sign.
“Research has found that households in fuel poverty are reducing their energy consumption to dangerously low levels,” according to Simon Francis, co-ordinator of the End Fuel Poverty Coalition. “Some of the UK’s poorest households use 21 per cent less energy during cold weather than other households, leaving them exposed to potentially dangerous, cold and damp homes.”
Price Cap Fail
Energy regulator Ofgem’s price cap is designed to ensure suppliers recoup their costs without overcharging customers. But despite rising wholesale prices, UK energy companies have amassed excess profits of almost £4 billion during the crisis, according to Citizens Advice figures.
“Networks should now do the right thing and give this money to those billpayers still struggling, by funding much-needed debt relief and targeted energy bill support,” says Citizens Advice’s chief executive, Dame Clare Moriarty. In the meantime, maybe it’s time to put that kettle on — and warm up with a cup of tea.
Methodology & Sources
To discover the postcodes, postcode districts and cities that use the most electricity annually in the UK, we looked at the latest Gov.uk dataset from the Department of Energy. (The Gov.uk dataset does not include data for Northern Irish postcodes.)
We ranked postcodes with at least 10 electricity meters (households) and postcode districts with at least 1,000 meters.
Grouping the postcodes into cities also allowed us to calculate the average annual electricity consumption by city.
To estimate the average annual spend by postcode, postcode district and city, we used electricity rates by region from uSwitch (https://www.uswitch.com/gas-electricity/guides/why-are-energy-rates-different-by-region/) in conjunction with each location’s annual electricity consumption.
Data is correct as of January 2025.